Environmental Data Analysis
About
Through a series of multi-scalar modules—global, national, regional, and city-level—we explored pressing environmental issues such as urban heat waves, renewable energy transitions, transportation-related emissions, and urban heat island effects. Each module combined climate data, geospatial analysis, and computational modeling in R to derive actionable insights for planners. This project synthesizes those analytical skills to assess spatial vulnerabilities, model future scenarios, and propose planning strategies grounded in data-driven environmental decision-making.
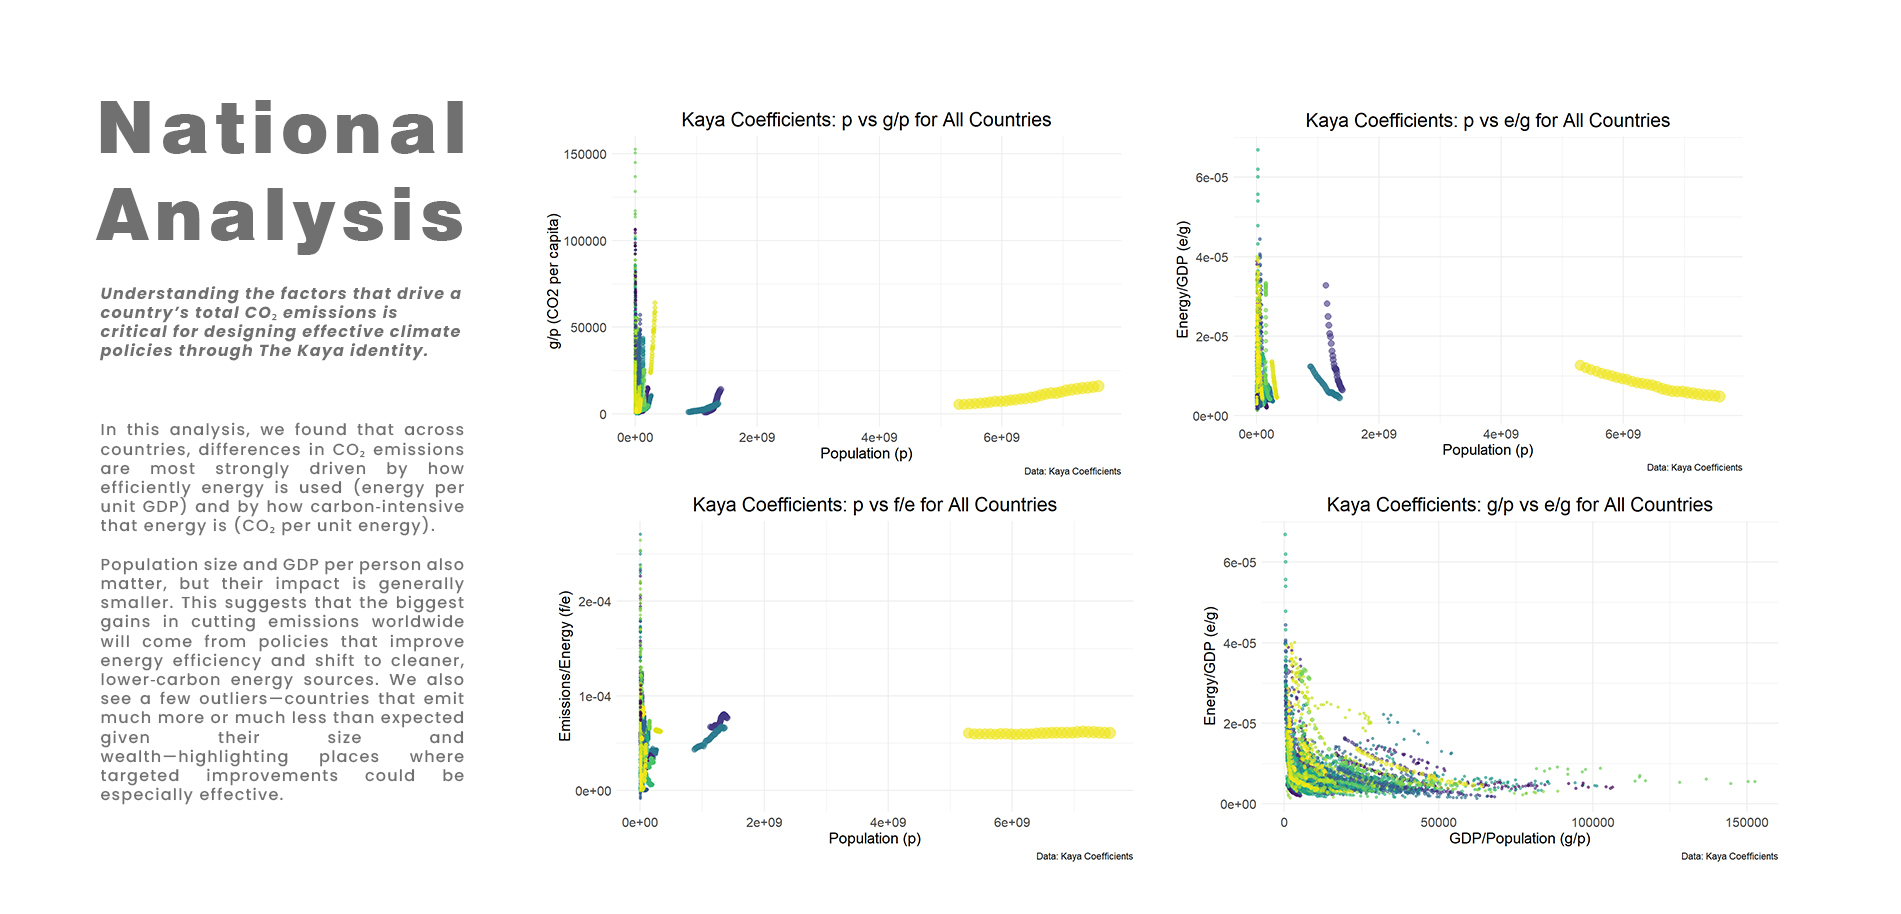
National Analysis
We applied the Kaya identity framework to a global sample of countries, using R Markdown to (1) compute and tabulate each nation's regression coefficients for population (p), GDP per capita (g/p), energy intensity (e/g), and emissions efficiency (f/e) via a purrr-powered workflow; (2) generate pairwise scatter plots of those coefficients—sized by population and complete with titles, legends, and axis labels; and (3) offer a concise interpretation of the observed patterns and outliers, revealing which drivers most strongly explain cross-country CO₂ differences and where policy interventions could yield the greatest emissions reductions.
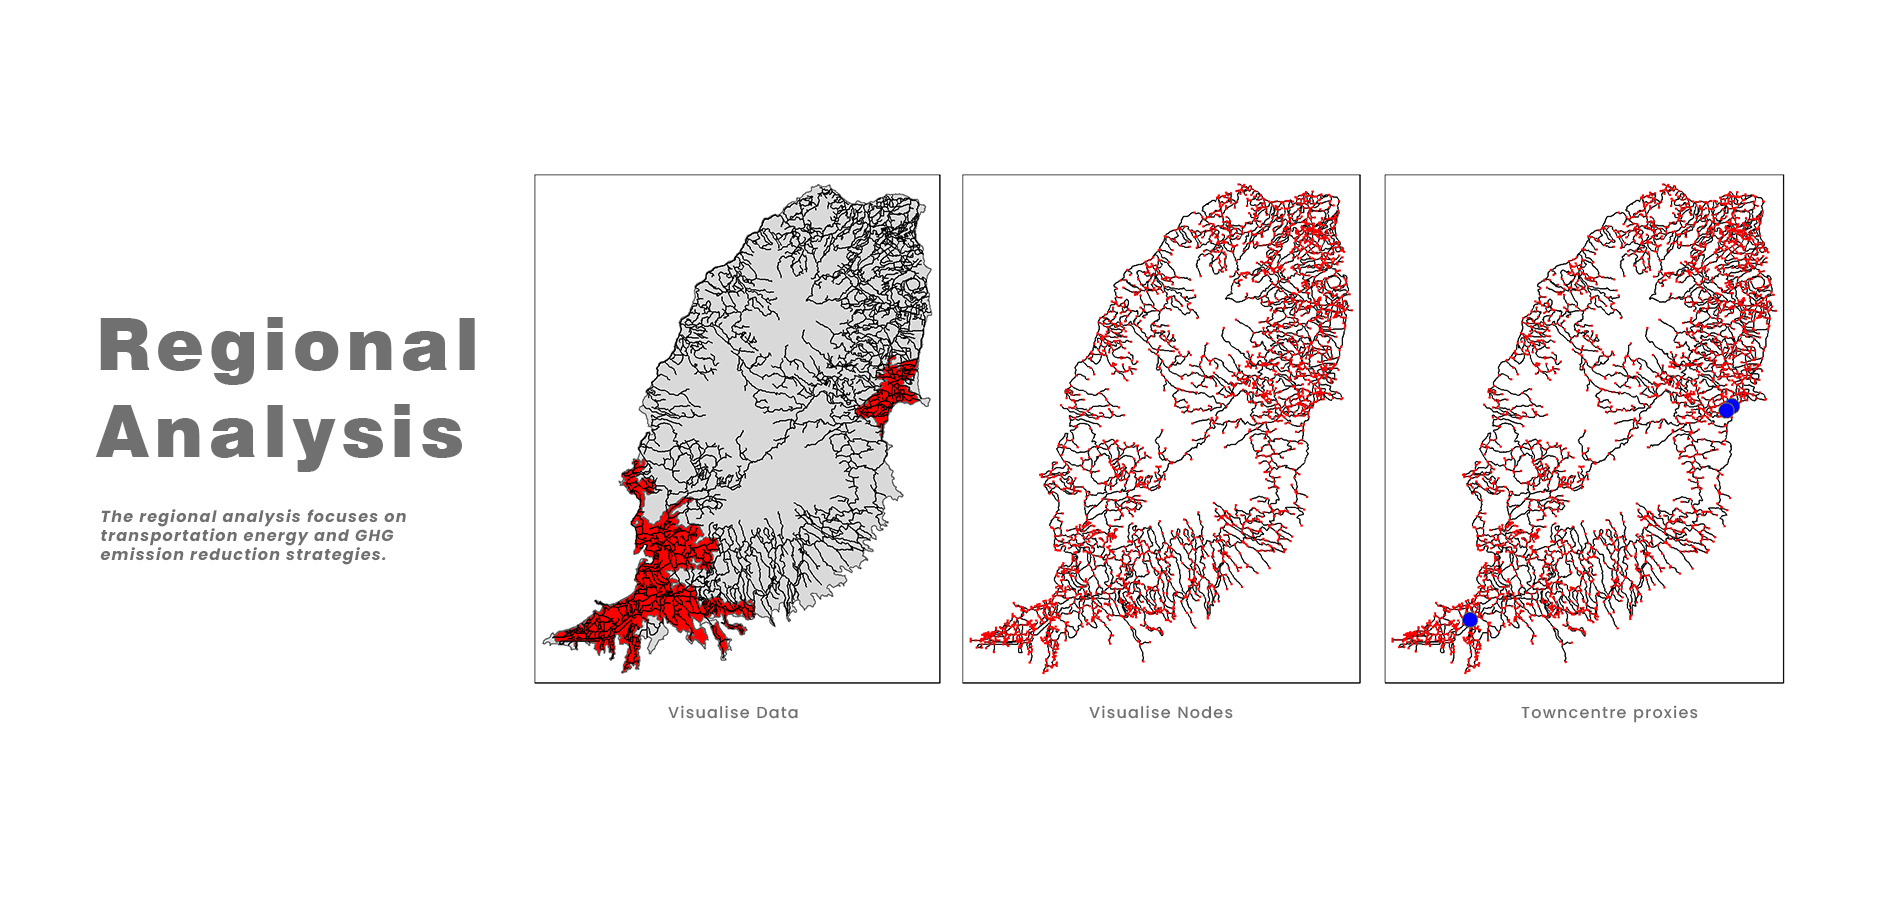
Regional Analysis
The regional analysis projects Grenada's VMT for 2020 and 2040 by sampling one of two annual growth rates (1.003 or 1.005) from a 2015 population baseline, estimating vehicles at one per two people, and computing two-way travel between St. George and Grenville. Running 20 simulations per year produces a VMT table and mean projections, revealing how demographic changes could drive future travel demand.
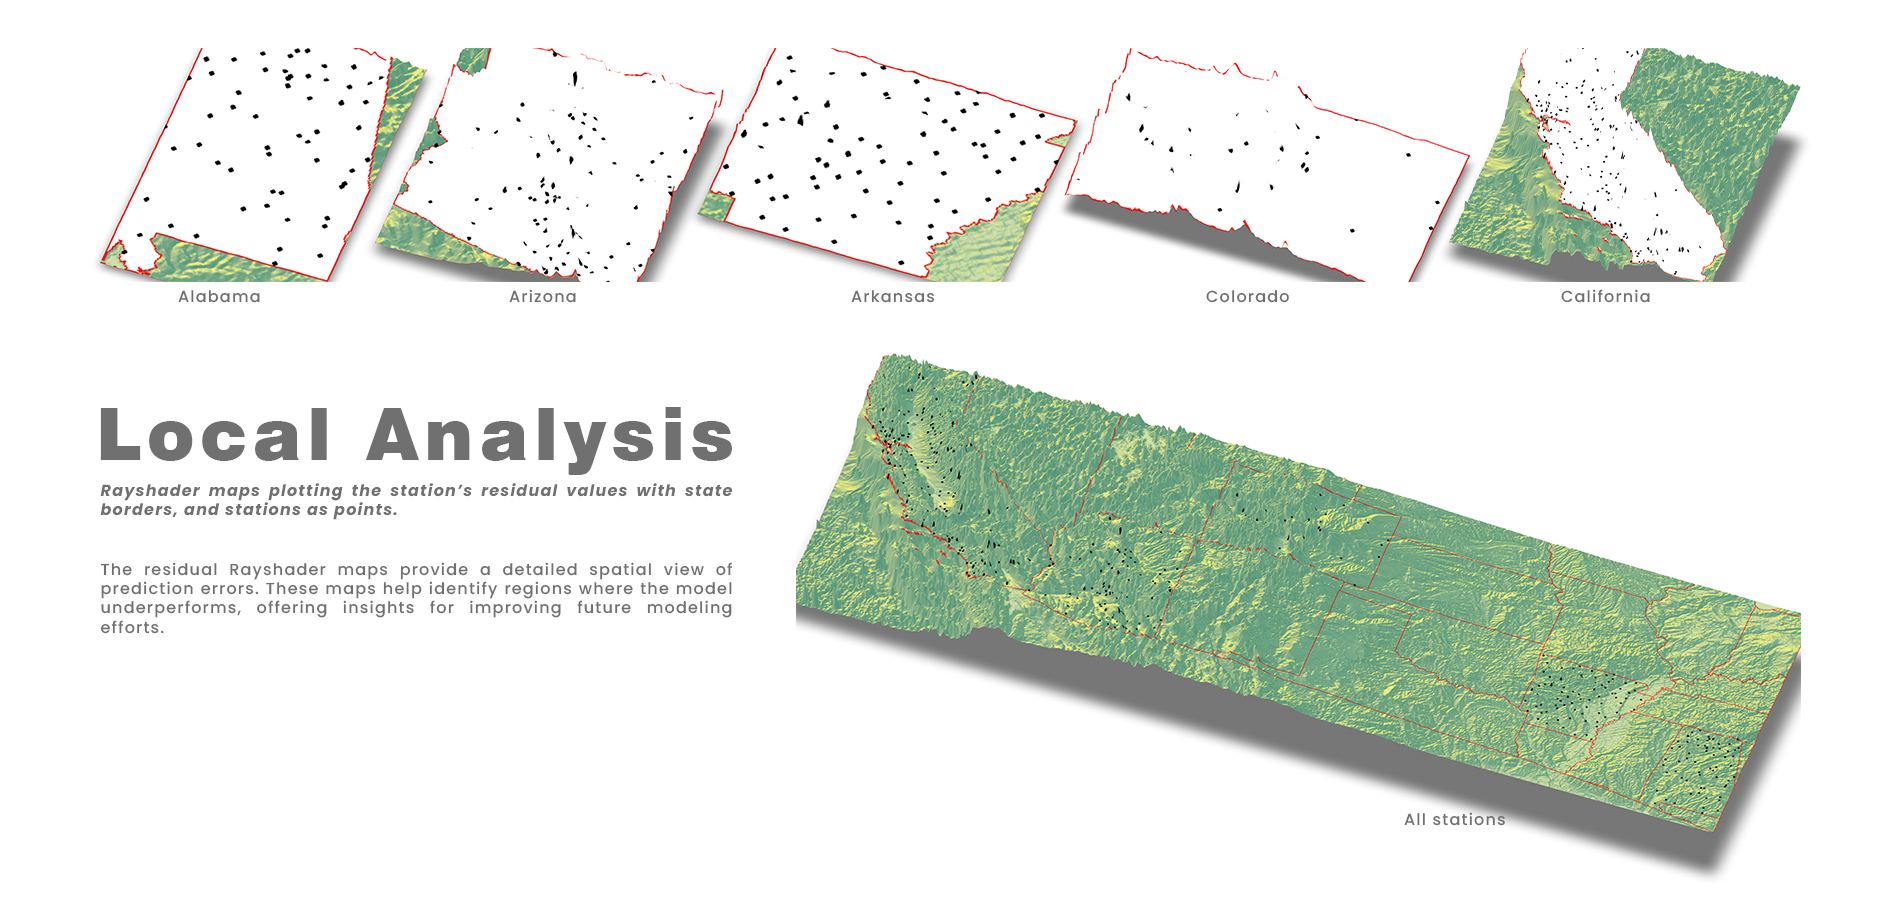
Local Analysis
We applied geospatial and machine‐learning methods to quantify urban heat island effects across the continental U.S. We compute each station's 2022 daily temperature range, extract spatial predictors (night lights, urban footprint, population density, climate zone, elevation), and fit three regression models—linear, random forest, and XGBoost—evaluating them by RMSE. After choosing the best model, we produce state‐level 3D ray-shader maps of its residuals, overlaying station points and state borders to visualize spatial patterns of over- and under-prediction.