Computational Modeling Project Main Image

Computational Modeling

Project Type Parametric Design
Role Individual Project
Tools Used Grasshopper, Python, Rhino
Course A4162‑1 / Summer 2024 / Computational Modeling
Course Instructors Luc Wilson, Meli Harvey
View Project
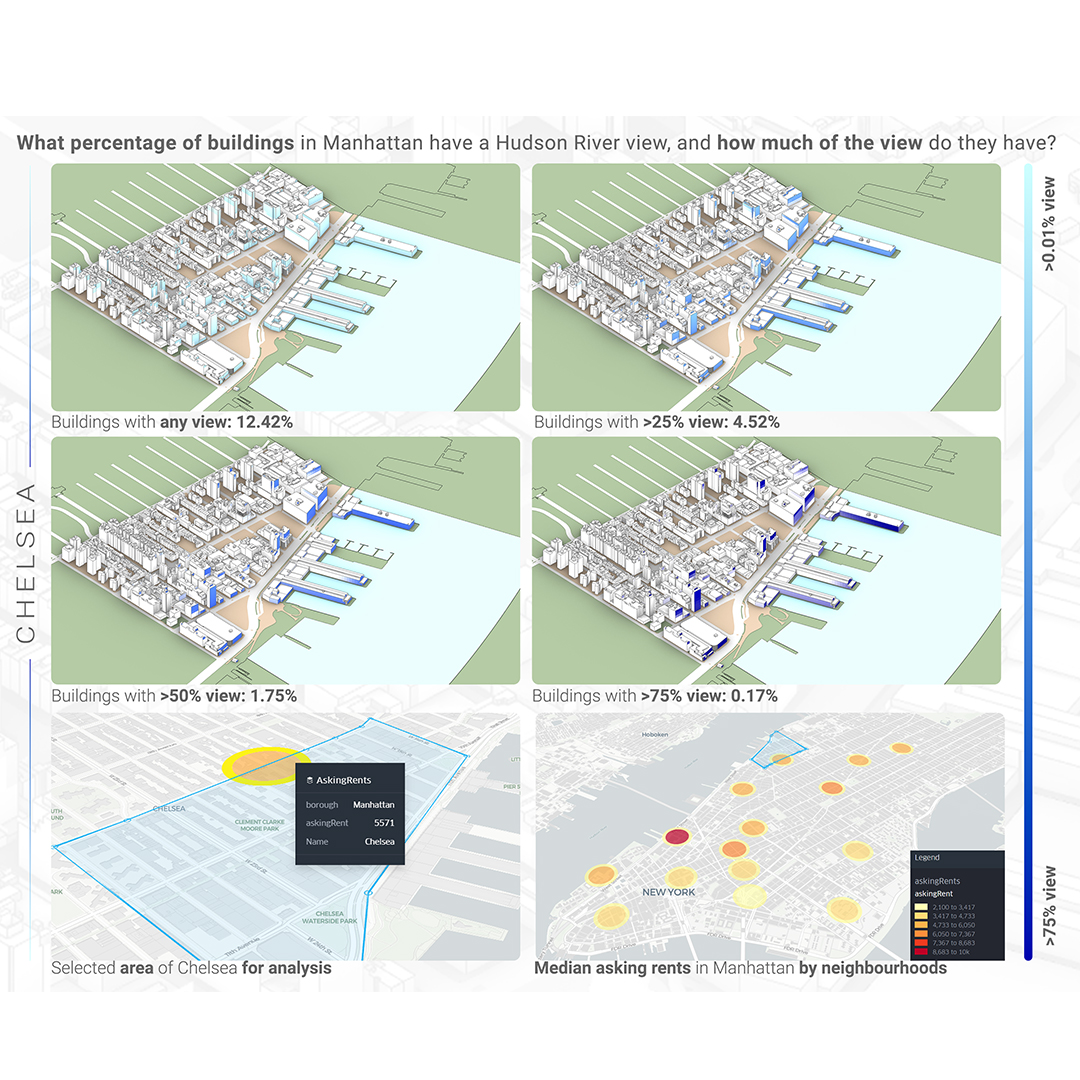
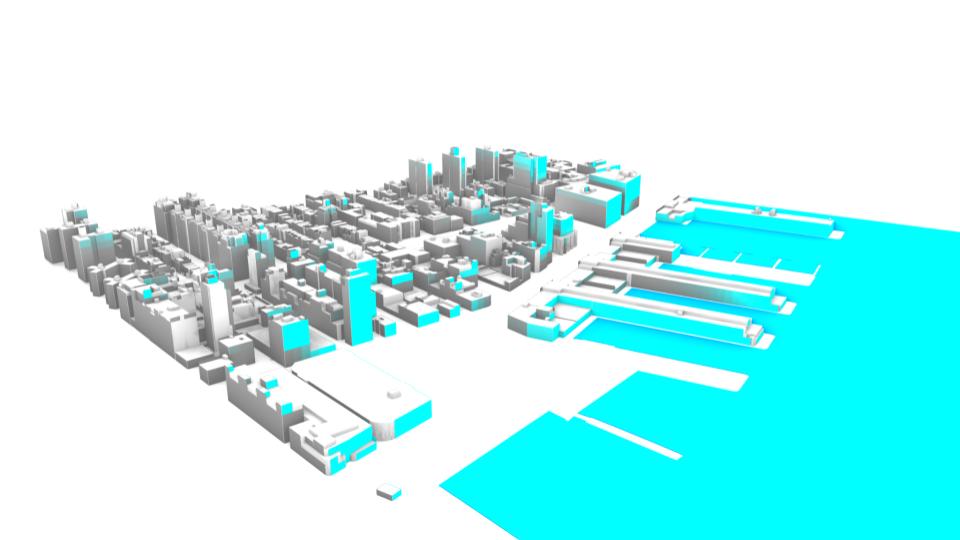
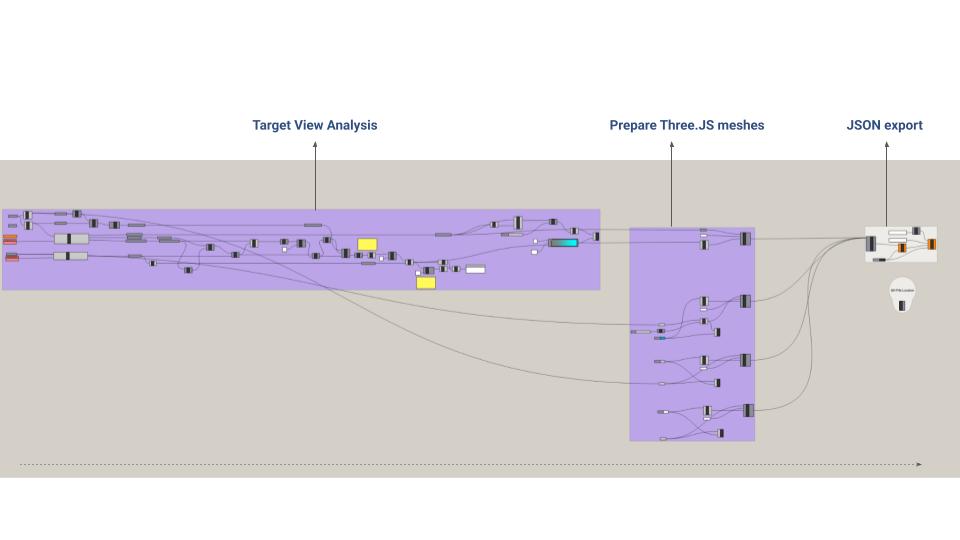
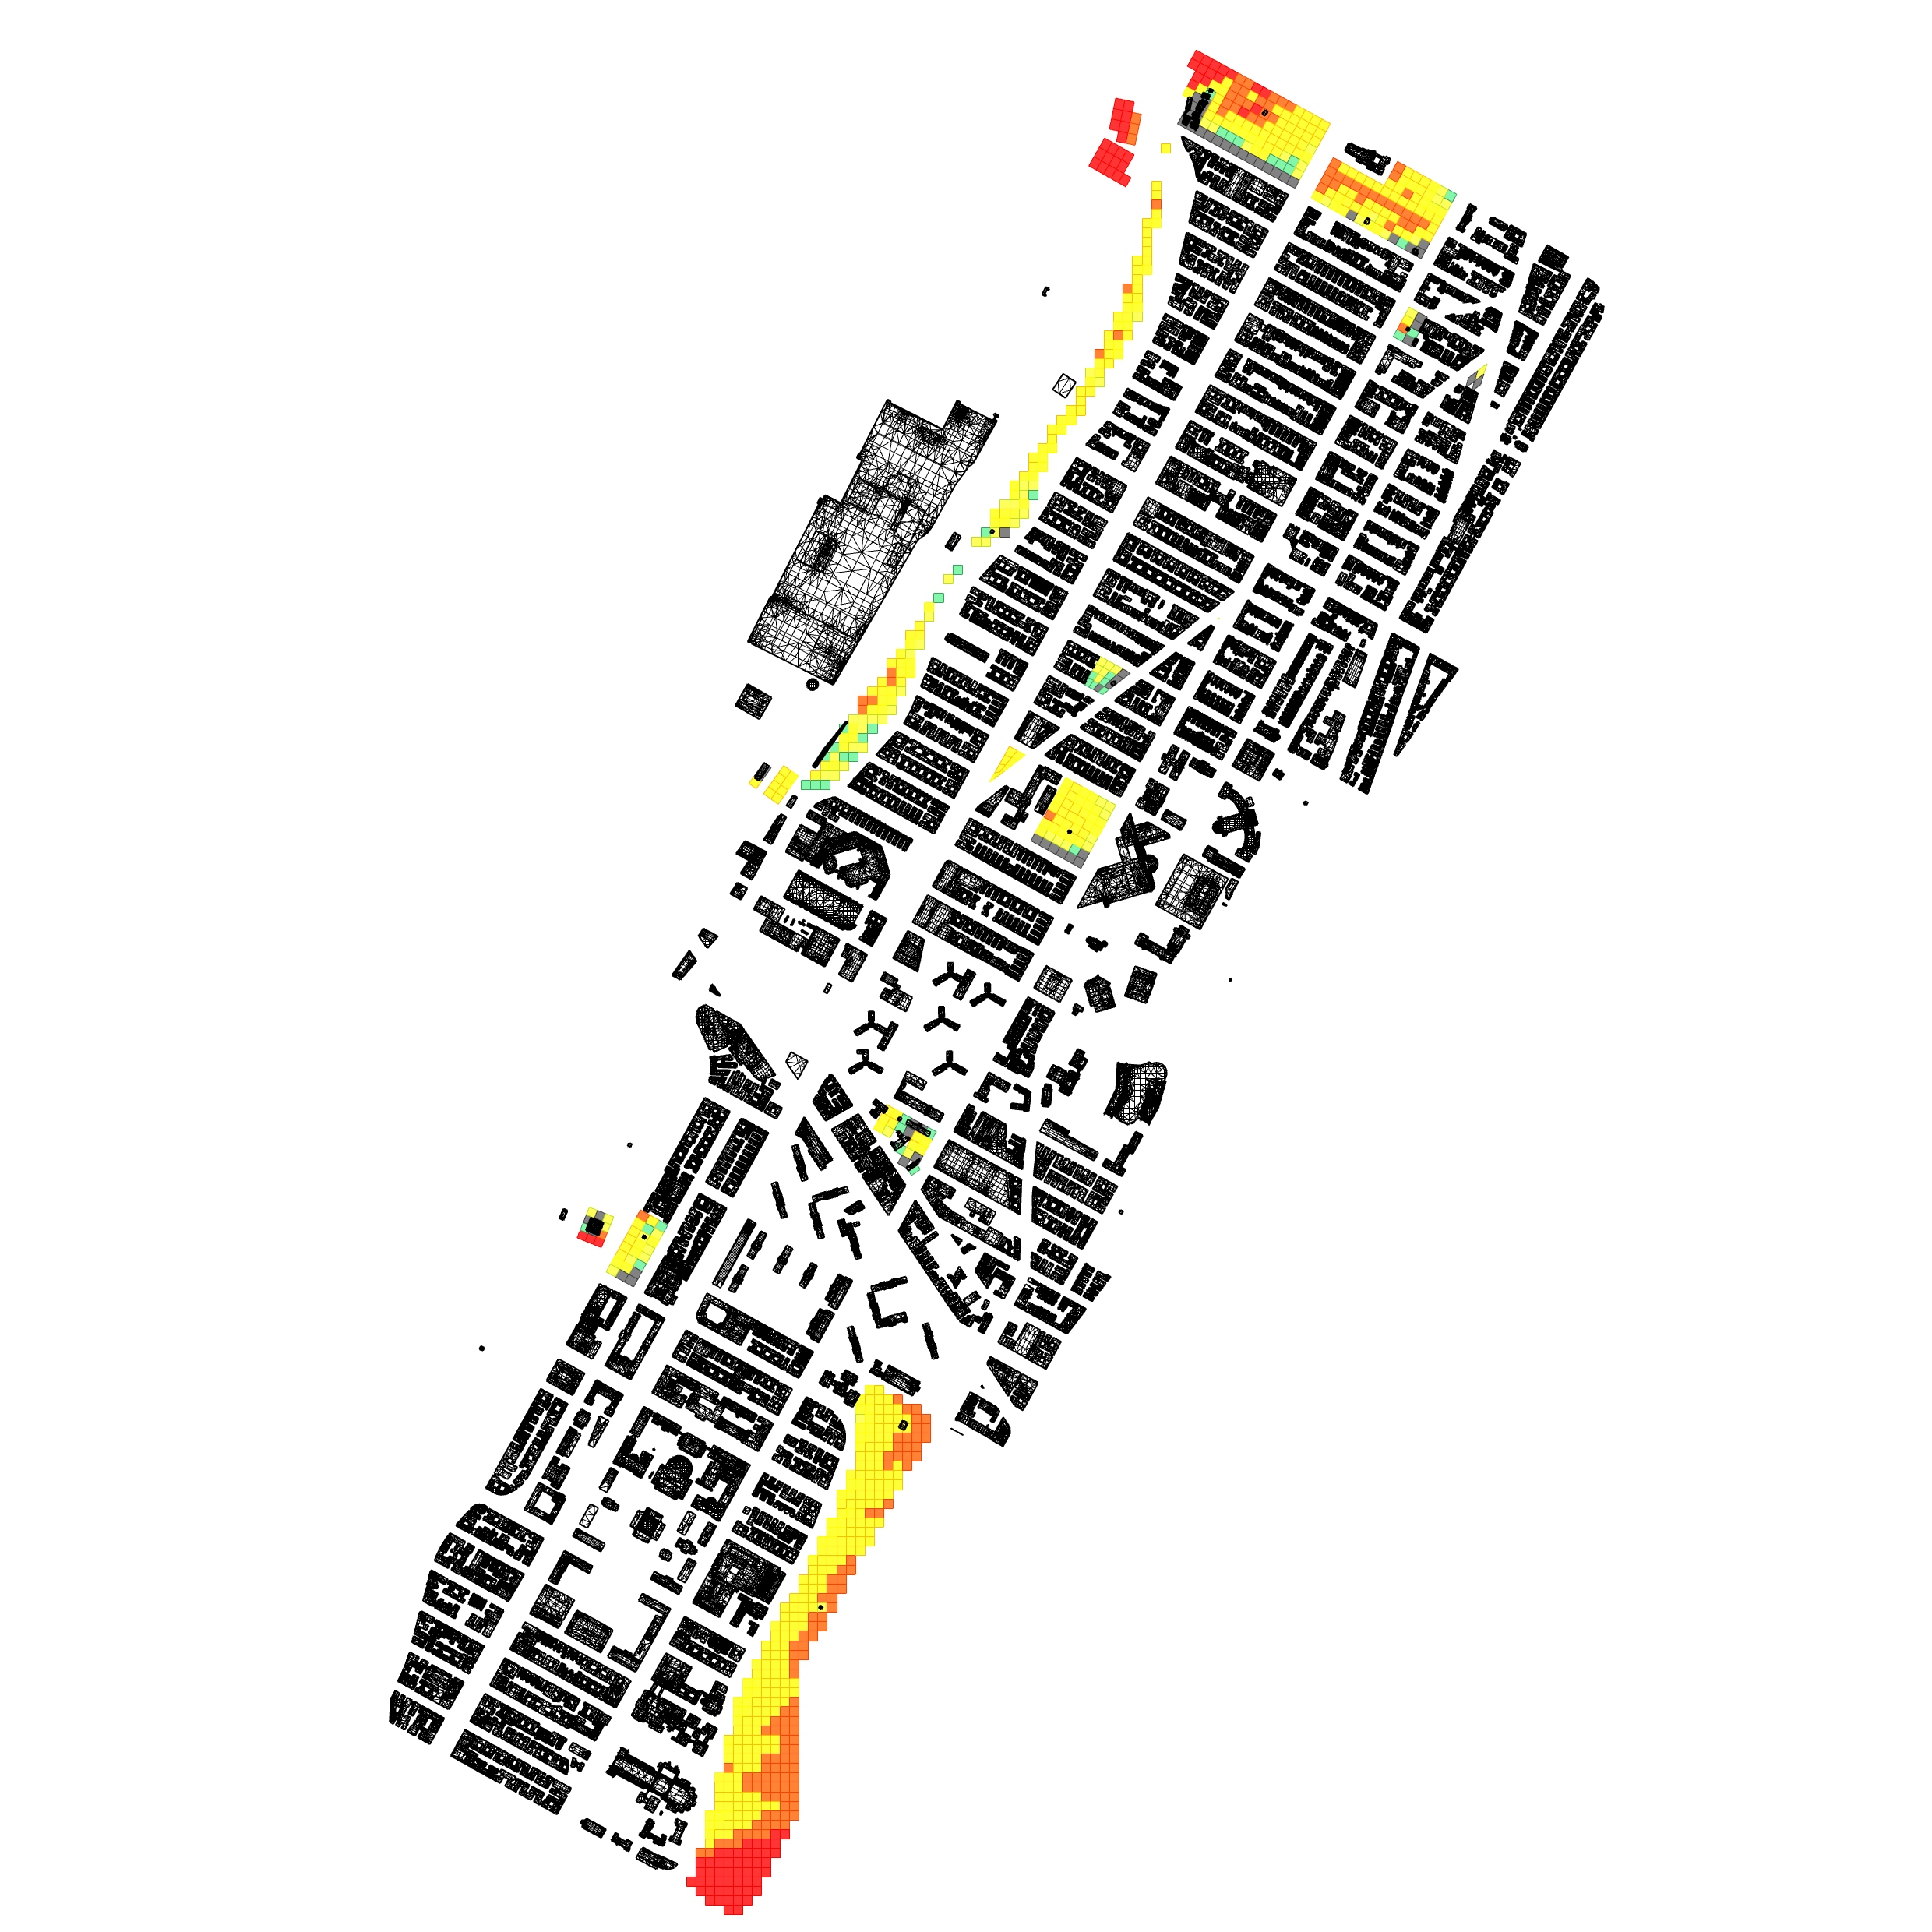
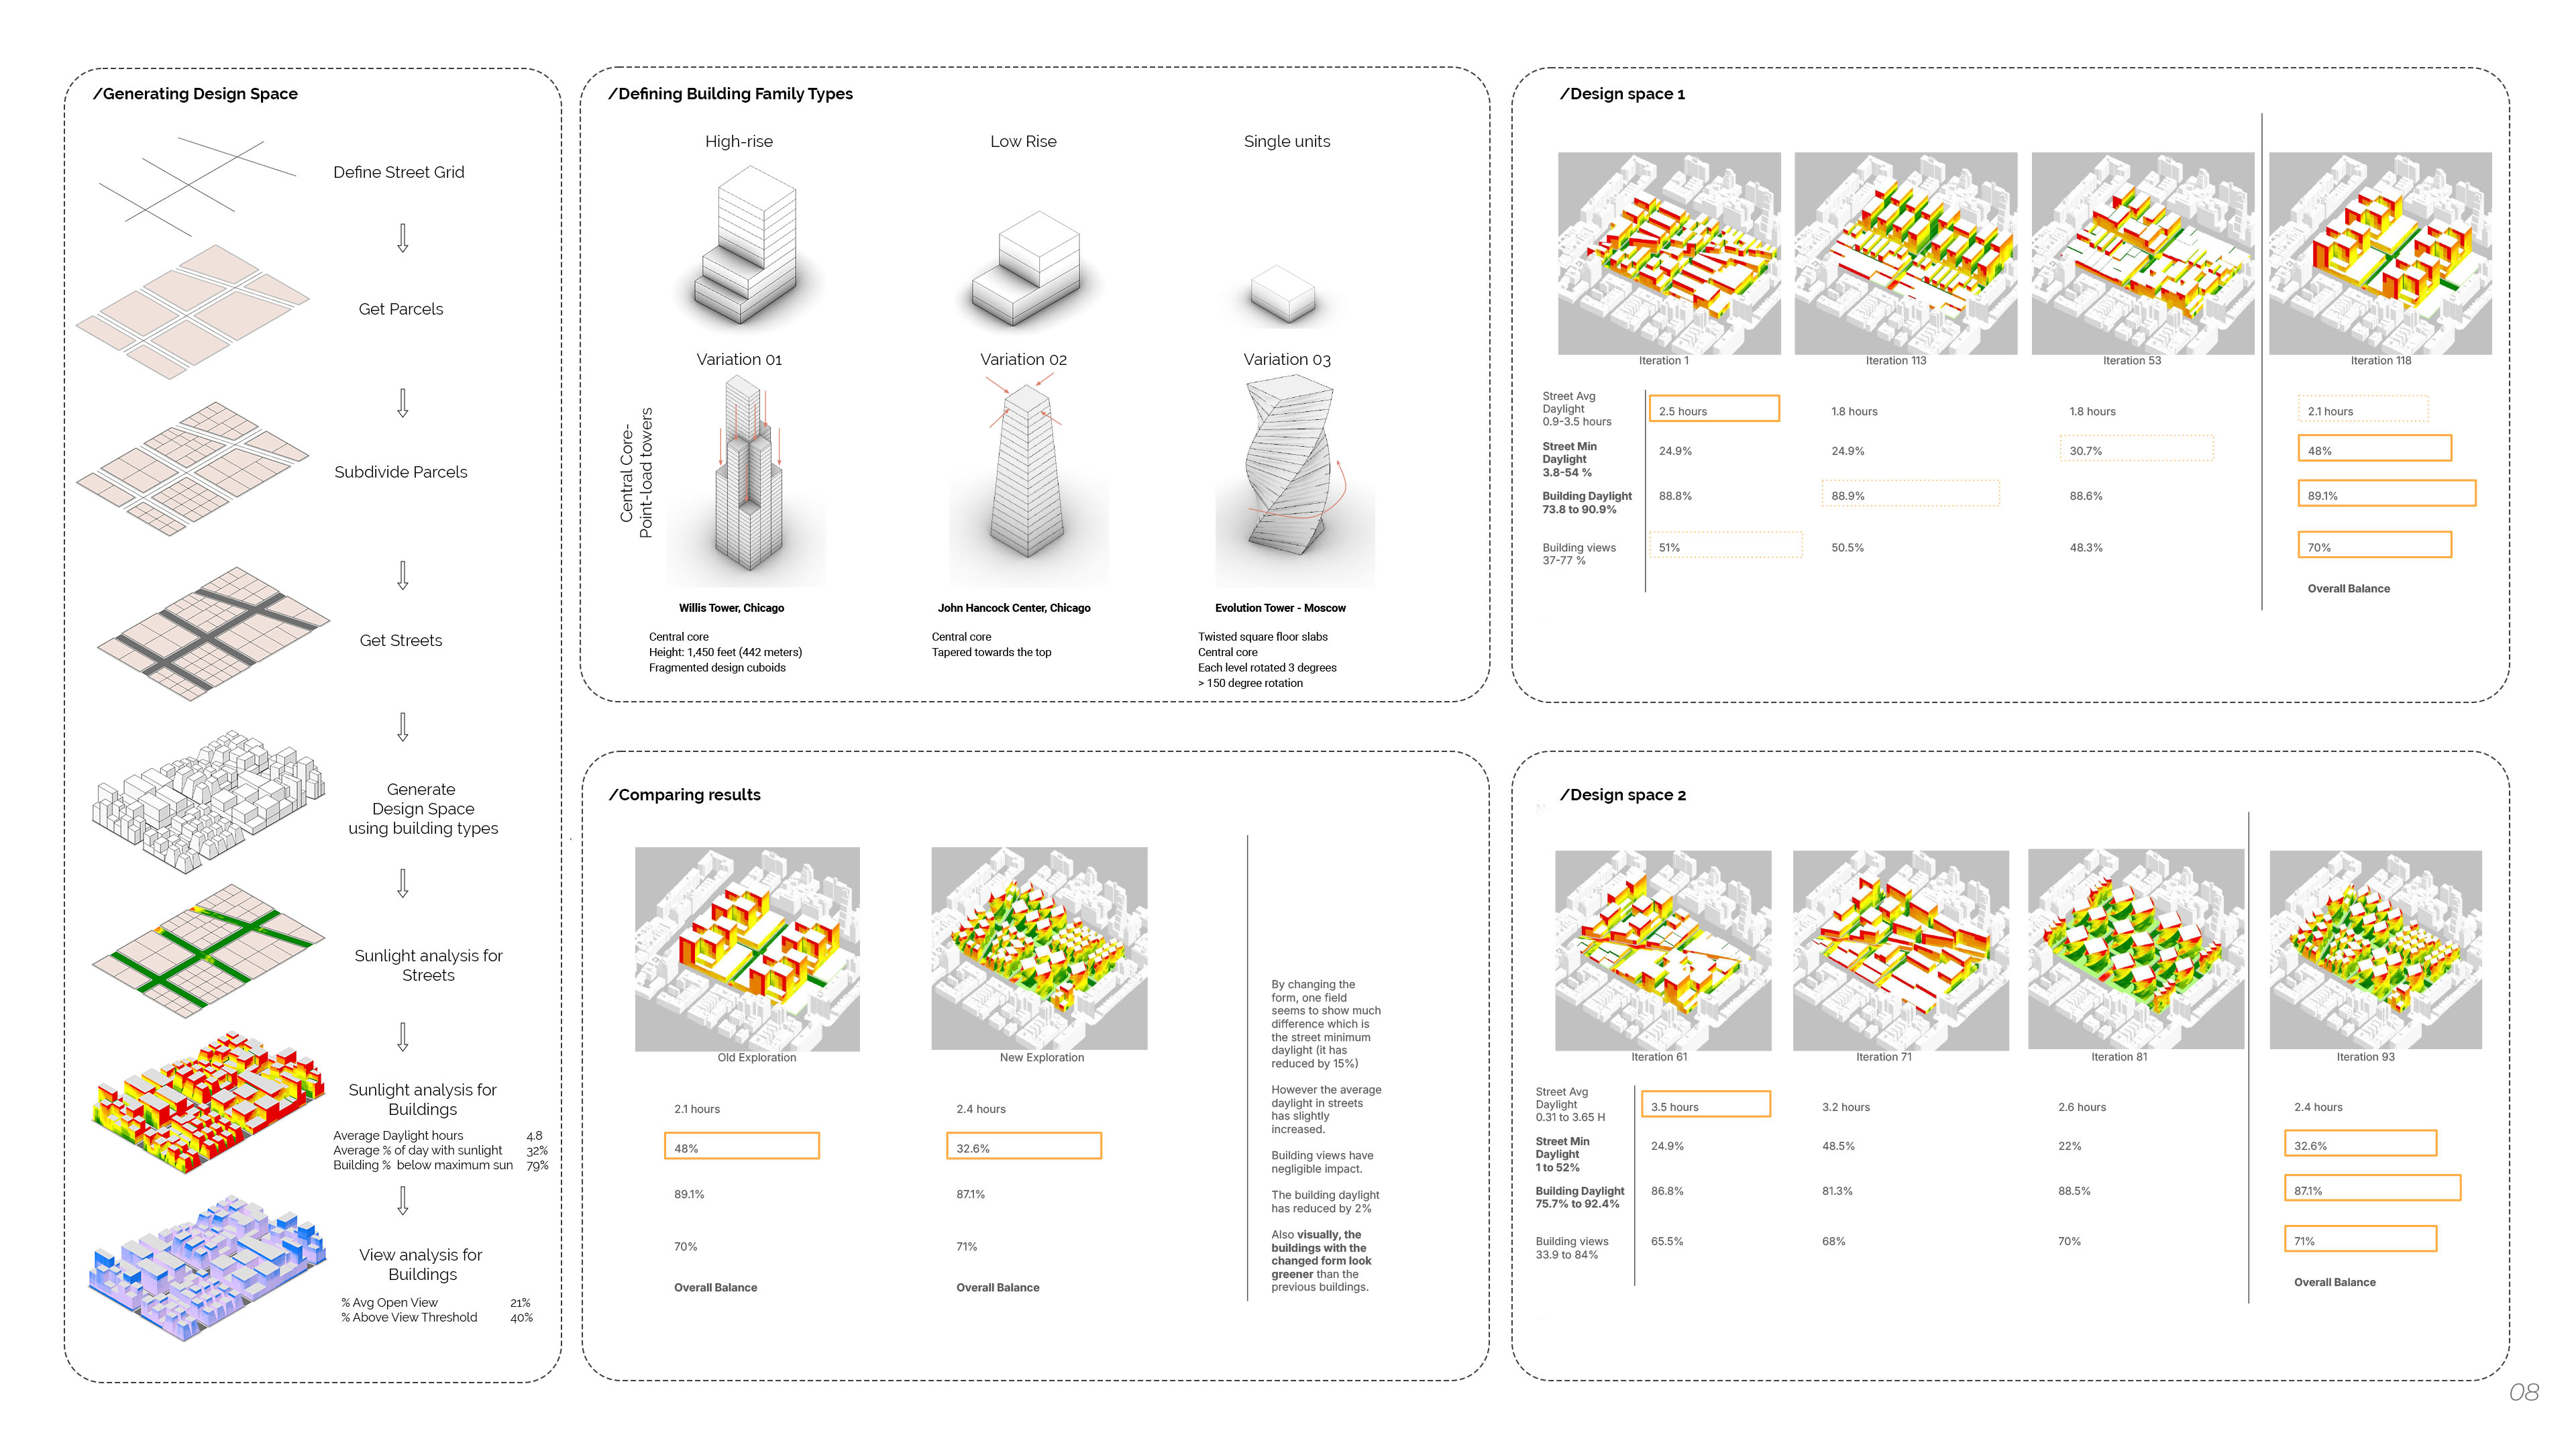
Over the semester, we leveraged Rhino and Grasshopper as a powerful GIS and computational design suite—importing shapefiles and CSVs, performing spatial joins, and extracting geometry to map streets, parcels, and environmental data—while simultaneously building parametric building and network models linked to daylight, wind, and energy analyses. We developed custom Grasshopper tools for origin–destination and walkability metrics, iteratively testing scenarios via live sliders, then exported our results as GeoJSONs and 3D JSONs for interactive web visualization in Scout and Mapbox.
Asking Questions With Data

The idea came from an urban observation and hypothesis that the rental prices in Manhattan are influenced by the views of the Hudson River. For the final project, I developed a computational model to investigate the relationship between the Hudson River and rental prices in Manhattan. Leveraging spatial data and custom view analysis tools in Grasshopper, I examined a section of Chelsea to quantify the influence of river views on rental valuations. The project demonstrated how computational modeling can be used not only for generative design but also for targeted urban analysis grounded in real-world data.

Computational Modeling Main View
Computational Modeling Process
Interactive View

Explore the interactive version of this project through the embedded viewer below.

The process involved developing custom tool in Grasshopper to analyse the views of the Hudson River from the buildings in the area, quantify and visualise the data, and export geometry as Three.JS to embedd in the website. The rental data was sourced from Zillow and the spatial data was obtained from OpenStreetMap. I used python to clean the dataset and used Kepler.gl to create the interactive map, while visualising the data using a combination of Chart.js

GH to GIS

Using Rhino and grasshopper as GIS tool to derive spatial relationships

NYC Carbon Atlas Overview
NYC Carbon Atlas Analysis
Procedural Urbanism

For this course, we built a parametric design space in Grasshopper—generating and exporting hundreds of massing options and their performance metrics—compiled the results into a structured CSV and color‐coded worksheet, analyzed form–performance trends to uncover how street grids and density distributions impact daylight and views, and distilled our findings into clear scenario-based design guidelines and a concise slide deck reflecting on our workflow, biases, and next steps.

Computational Modeling Process