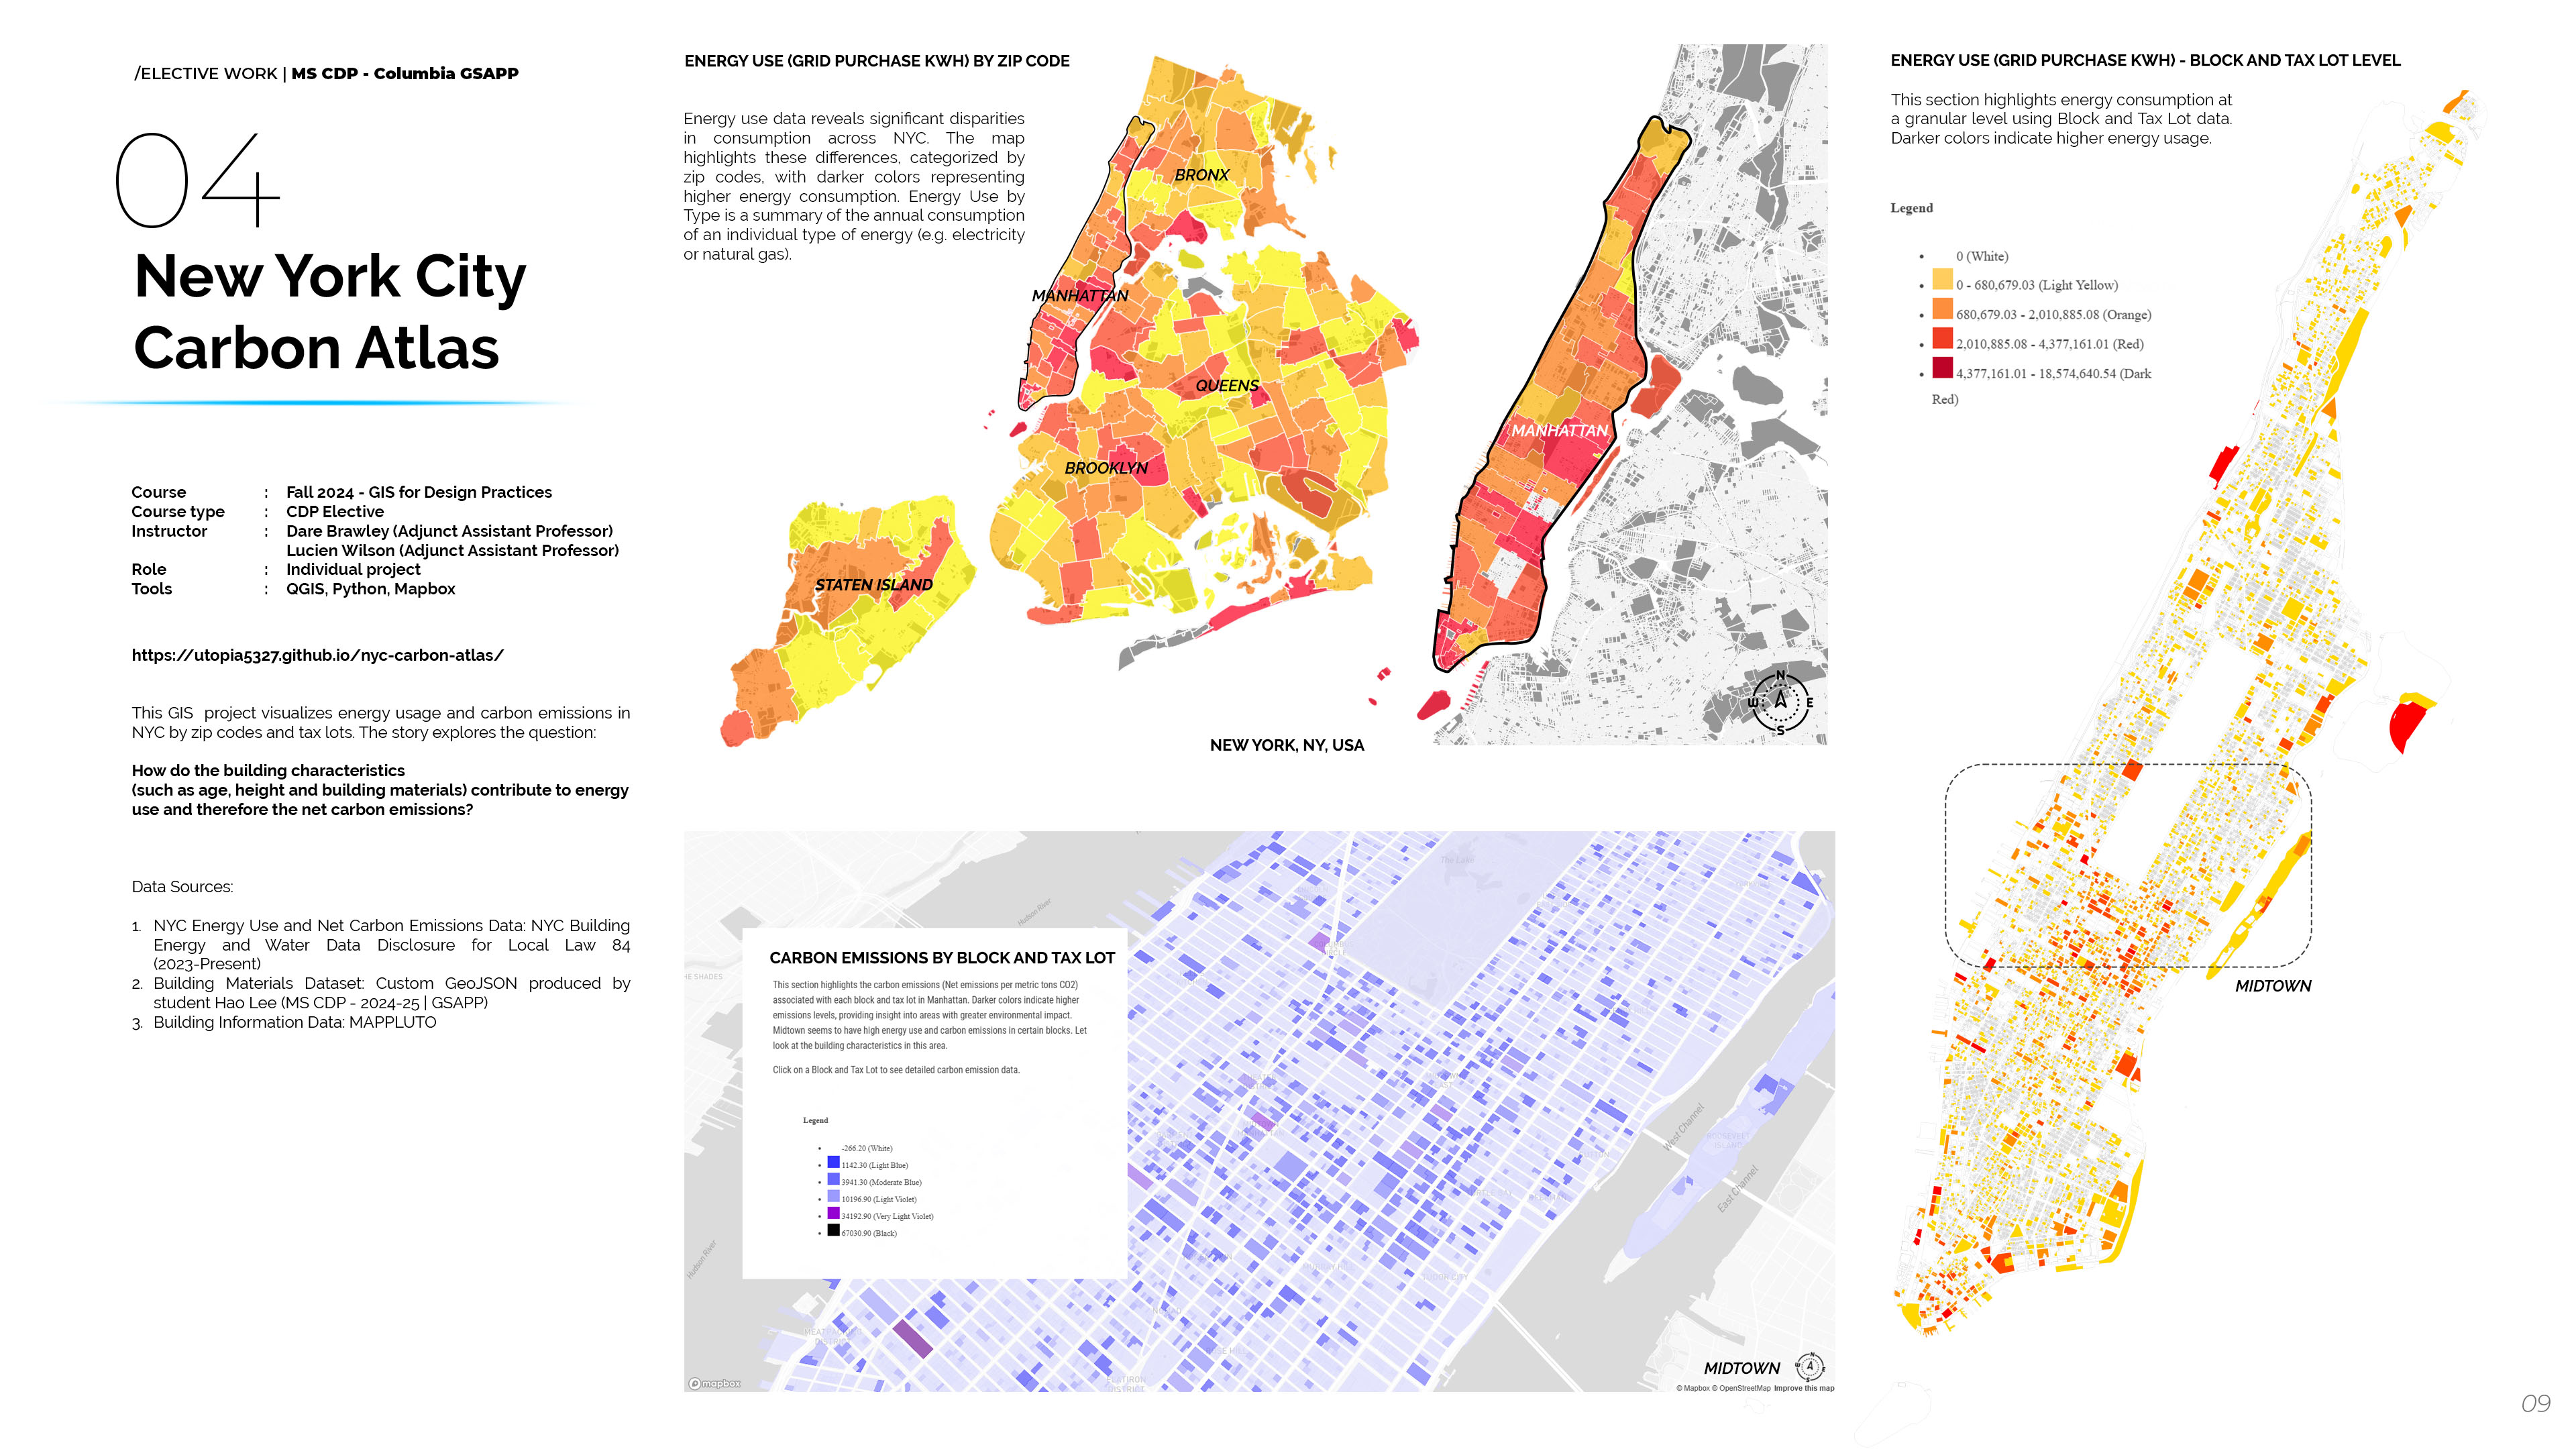
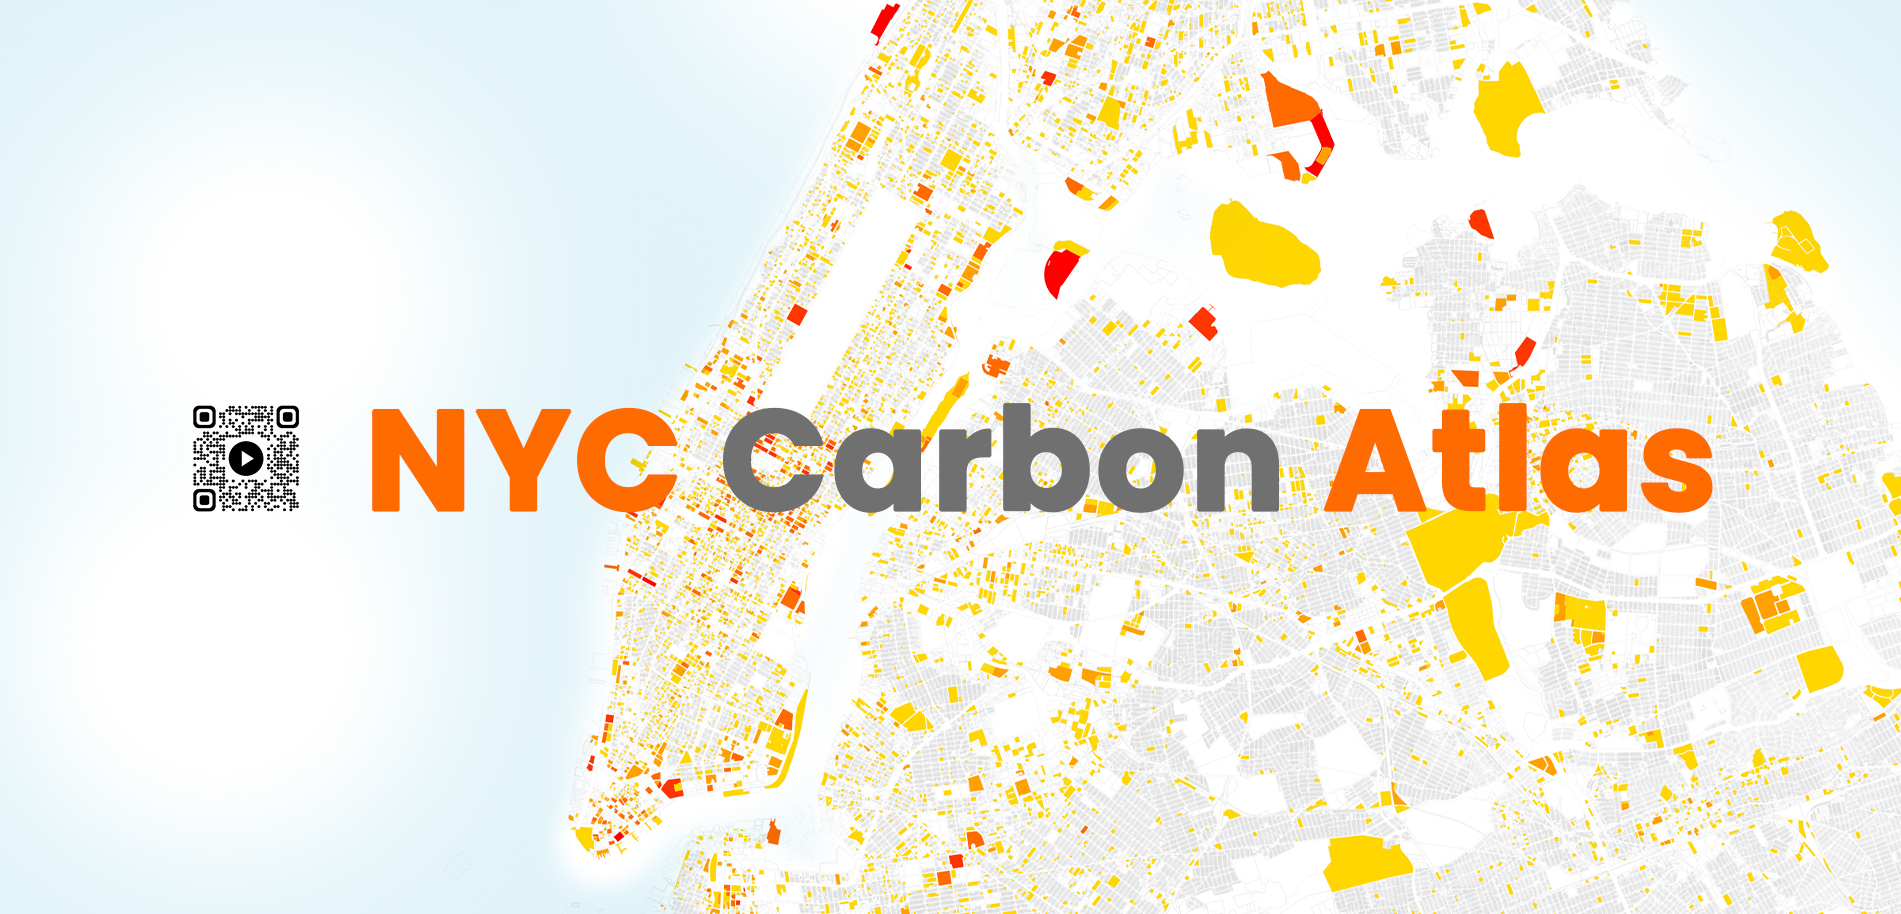
NYC Carbon Atlas Project Main Image

NYC Carbon Atlas

Project Type Geographic Information System (GIS), Data Visualization and Mapping
Role Individual Project
Tools Used Python, QGIS
Course A6939-1 / Fall 2024 / GIS for Design Practices
Course Instructors Dare Brawley, Mario Giampieri
View Atlas
NYC Carbon Atlas is an innovative data visualization project that maps and analyzes carbon emissions across New York City's five boroughs.

This project combines urban data analysis, environmental science, and interactive visualization to create a comprehensive understanding of the city's carbon footprint and identify opportunities for sustainable urban development.
About

The NYC Carbon Atlas represents a groundbreaking approach to urban environmental analysis, combining spatial data with carbon emission metrics to create an interactive visualization of New York City's environmental impact. Through advanced data processing and visualization techniques, the project reveals patterns and correlations between urban density, building types, transportation networks, and carbon emissions. This comprehensive mapping tool serves as both an analytical resource for urban planners and an educational platform for understanding the complex relationship between urban development and environmental sustainability.

NYC Carbon Atlas Overview
NYC Carbon Atlas Analysis